|
A graph or chart is used to present facts in visual form. They are a drawing that displays the relative sizes of numerical quantities. A graph is one of the easiest ways to compare numbers. 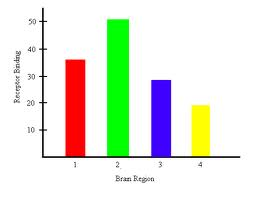
Bar Graph
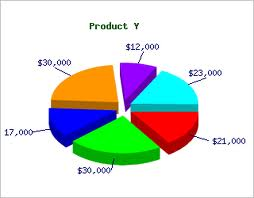
Pie Chart/Graph

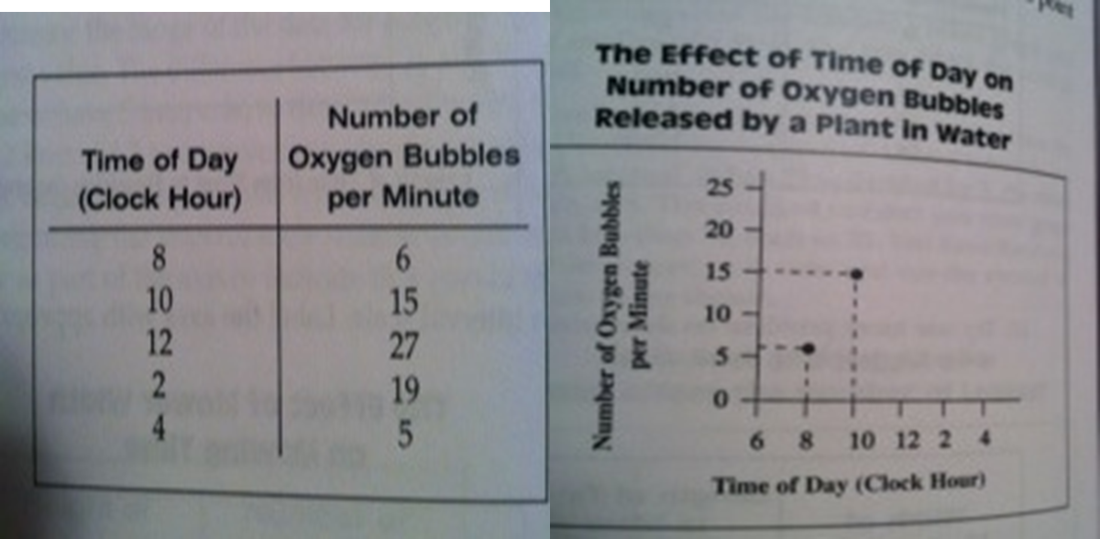
Scatter Plot Graph
|
|
-›Labeling the X and Y Axes
› -Determining Interval Scales for Each Axis › -Plotting Data Pairs as Points on a Graph
|
|
1. Find the range of data to be graphed by subtracting the smallest number from the largest data value.
2. Determine how many intervals you want to have on the axis. Divide the range by the number of intervals you want. 3. Determine the size of each interval by dividing the range of the data by the number of intervals you want. 4. Begin labeling the scale using multiples of the rounded number.
|